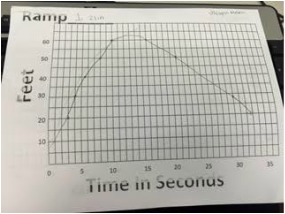
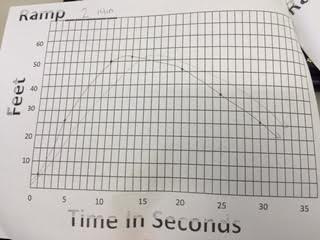
  | This is the one where they let go of a skateboard that goes down a ramp and I had to predict what would happen and then plotted points of what actually happened. My predictions before i actually plotted points, was very close to accurate. The zeros of my graph represent the starting time. The graphs relate to each other by the shape it makes and how that all go up and then down except for graph number three because it stops. The graph rises the fastest at the beginning because that is when it is going the fastest | 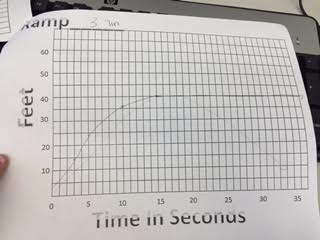 |
 RSS Feed
